Chapter 10 Dashboards
10.1 Summary
This chapter will introduce the development and design of dashboards. Dashboards provide high-level visual summaries of data collected for the purpose of exploring, monitoring or evaluating a complex system or situation.
They incorporate everything we have learnt about data visualisation: design, visual perception, colour, methods, interactivity and applications.
10.1.1 Learning Objectives
The learning objectives for this chapter are as follows:
- Define a data visualisation dashboard.
- Discuss the characteristics of a well-designed dashboard.
- Discuss the idea of visual emphasis and understand how dashboards use emphasis to guide a viewer’s attention.
- Discuss the common reasons that dashboards regularly fail in their design.
- Demonstrate the use of powerful R dashboard packages to develop dashboards.
10.2 Dashboards
10.2.1 Definition
The Merriam Webster Dictionary defines a dashboard as follows:
- “a screen on the front of a usually horse-drawn vehicle to intercept water, mud, or snow”
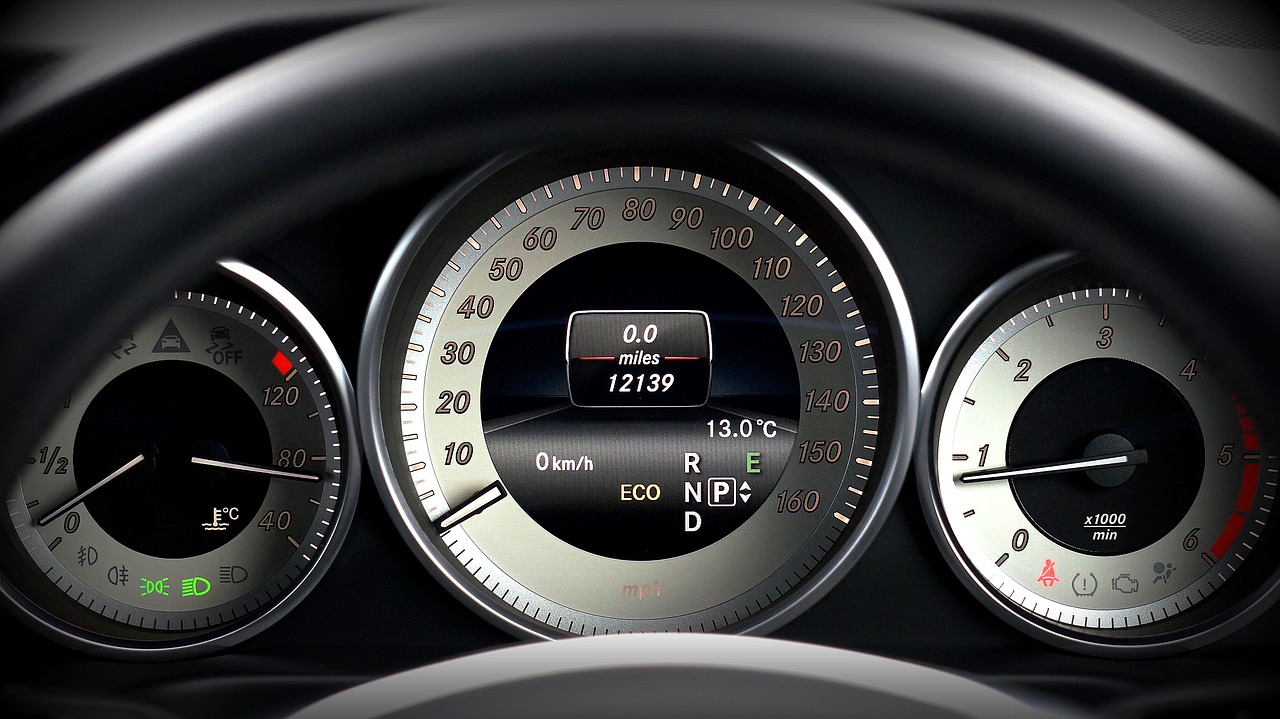
- “a panel extending across the interior of a vehicle (such as an automobile) below the windshield and usually containing instruments and controls”
The two definitions above have one thing in common. They both sit in front of the driver and are highly visible. The 2nd definition is closer to what this chapter has in mind. Automotive dashboards provide a driver with important information about the vehicle (e.g. speed, revs, fuel and engine temperature) which can be perceived at a glance. The entire dashboard is easily visible within the drivers field of view when they look momentarily down from the road. In fact, our infatuation with automotive dashboards is the reason behind many poor dashboard practices (e.g. the circular shape of many automobile dashboard gauges are based on polar coordinates).
Stephen Few (2006) provides a more relevant definition related to data visualisation dashboards:
“[Dashboards are a] [v]isual display of the most important information needed to achieve one or more objectives which fits entirely on a single computer screen so it can be monitored at a glance”
10.2.2 Good Dashboards
There are four important elements to this definition:
- Dashboards are visual
- Dashboards only contain the most important information needed for a very specific goal(s)
- Dashboards fit entirely on a single screen.
- Dashboards can be monitored at a glance.
According to Few (2006) a good dashboard has the following characteristics:
- Is exceptionally well organised
- Summarises and draws attention to important trends/unusual observations
- Targets a specific audience for a specific objective
- Is simple, concise and clear
- Uses best practice in data visualisation design and methods
Unfortunately, there are many more bad examples of dashboards than there are good. One good example that does come to mind is Google Analytics. Google Analytics includes a good dashboard for monitoring a website’s activity.
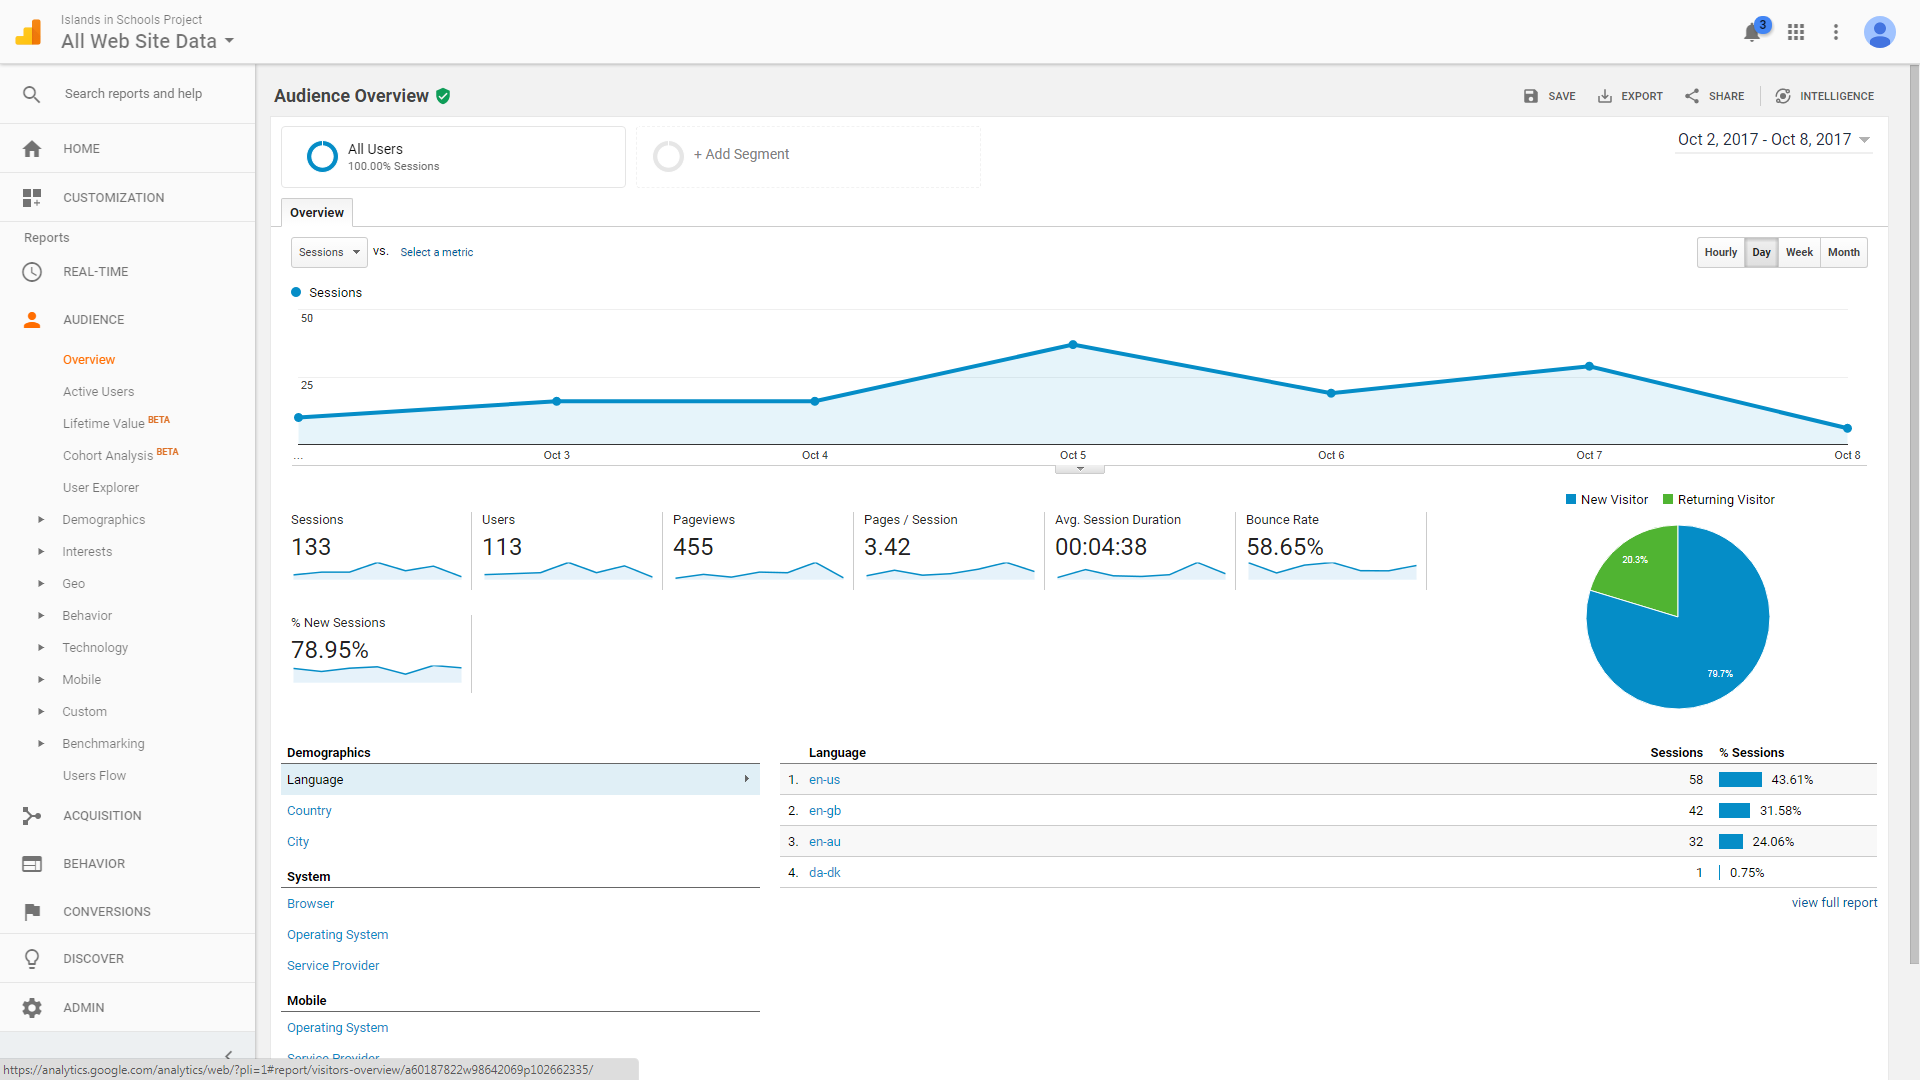
The dashboard is successful for the following reasons:
- It is well laid out, clutter-free and emphasises the data over the non-data elements
- Our eyes are primarily drawn to the most important plot - the time series plot showing visits to the website.
- Our eyes are also drawn to the pie chart (although I would personally replace them with a bar chart) which shows the proportion of unique and returning visitors. Smaller plots include additional metrics (page views, time on website, etc) and details like the language of different web browsers used to access the site (which tells you something about the visitors).
- The most important plots are targeted specifically at website owners who want to track the performance of their website.
- The mimimalist design is attractive and aesthetically pleasing.
- Colour is used with restraint and purpose
10.2.3 Bad Dashboards
Now let’s contrast this with a not-so-good example shown in Figure 10.1.
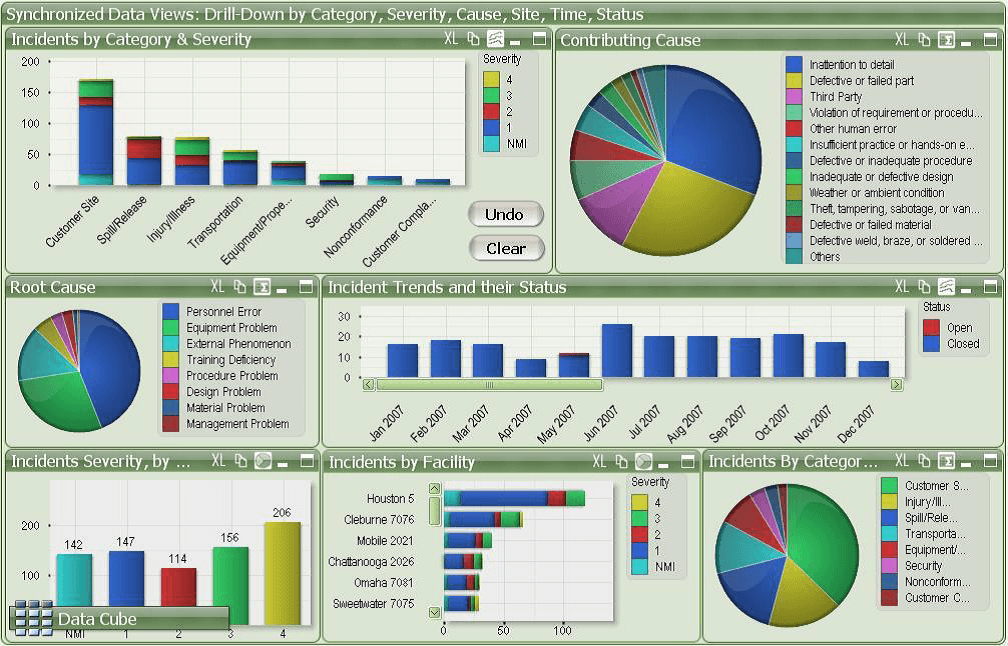
Figure 10.1: Example of bad dashboard design (Adnia Solutions 2020).
Why does this dashboard fail? There are many reasons but here are the big issues:
- Where do you start? Your attention is drawn equally to all elements of the dashboard. Not all elements are equally important, so both the organisation and layout are poor.
- Within some plots (e.g. Incident Trends and their Status), the viewer is required to scroll to see all the categories. Remember, good dashboards fit everything into one screen. No scrolling required.
- Colour is used inappropriately. Some plots have too many colour categories. The same colours are used for different variables. Colour is also used at some point without purpose (see bar chart bottom left).
- Poor data visualisation practice. The dashboard includes stacked bar charts and pie charts. These methods have perceptual issues that can be overcome using better methods.
- Aesthetically, the dashboard looks crowded. Are all these plots really necessary?
Few (2006) discusses some sure-fire strategies for making a bad dashboard. These can include the following common issues:
- Exceed the boundaries of a single screen
- Inadequate context for the data
- Excessive detail or precision
- Deficient measures
- Inappropriate data visualisation methods
- Meaningless variety
- Poorly designed data visualisations
- Misleading data visualisations
- Poor arrangement of plots and data
- Poor highlighting of important data
- Clutter and unnecessary decoration
- Poor colour use
- Poor aesthetics (ugliness)
10.2.4 Visual Emphasis
As dashboards incorporate a range of data visualisations on the same screen, it’s important to guide the viewer to the most important plots. According to Few (2006), visual emphasis refers to the placement of data visualisations at key areas of the dashboard in order to draw a viewer’s primary attention. The following figure explains the idea of visual emphasis according to Few (2006):
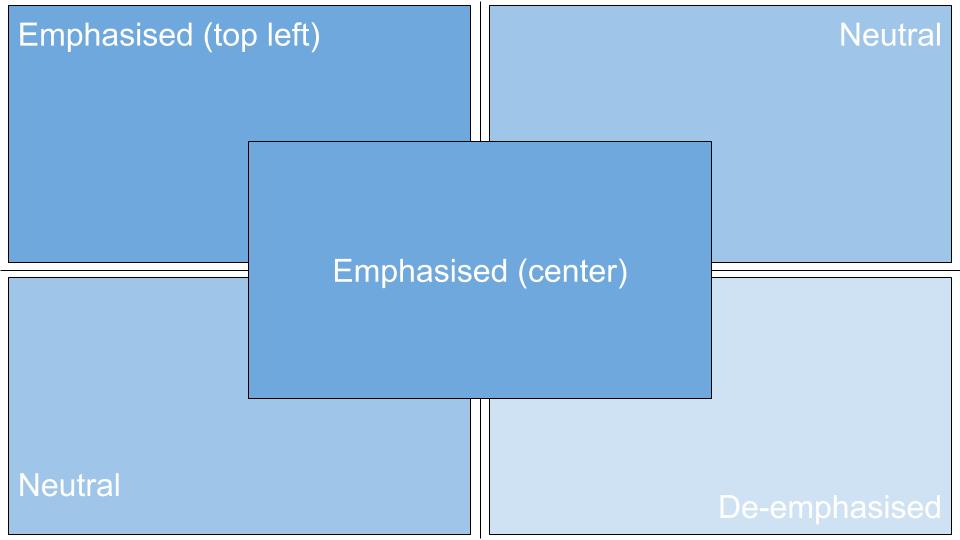
Therefore, center and top-left are the best places to position the most important data visualisations in a dashboard. Size is also important.
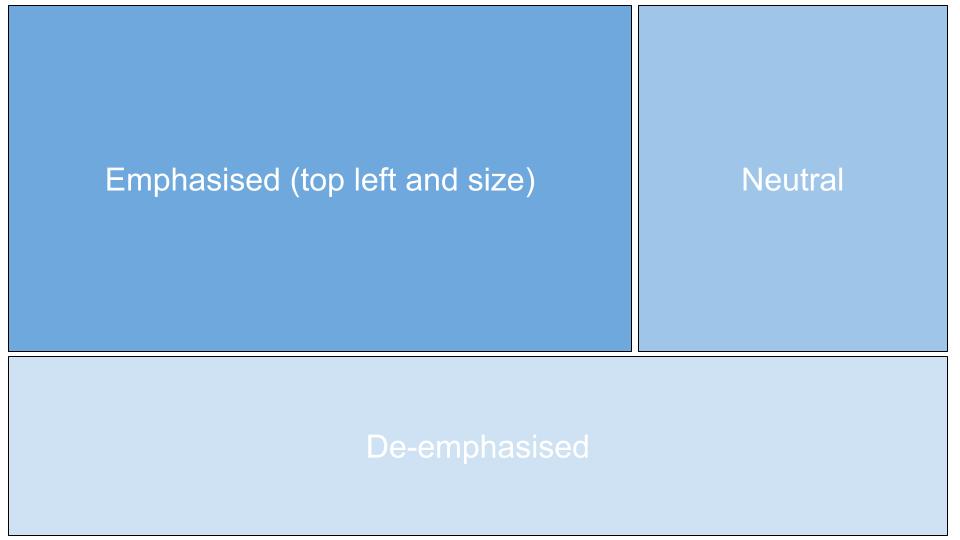
Size and position in combination is a powerful way to emphasise the most important information in a dashboard. Designers should also exploit other visual perception laws covered in Chapter 3.
10.2.5 Dashboards and Pie Charts
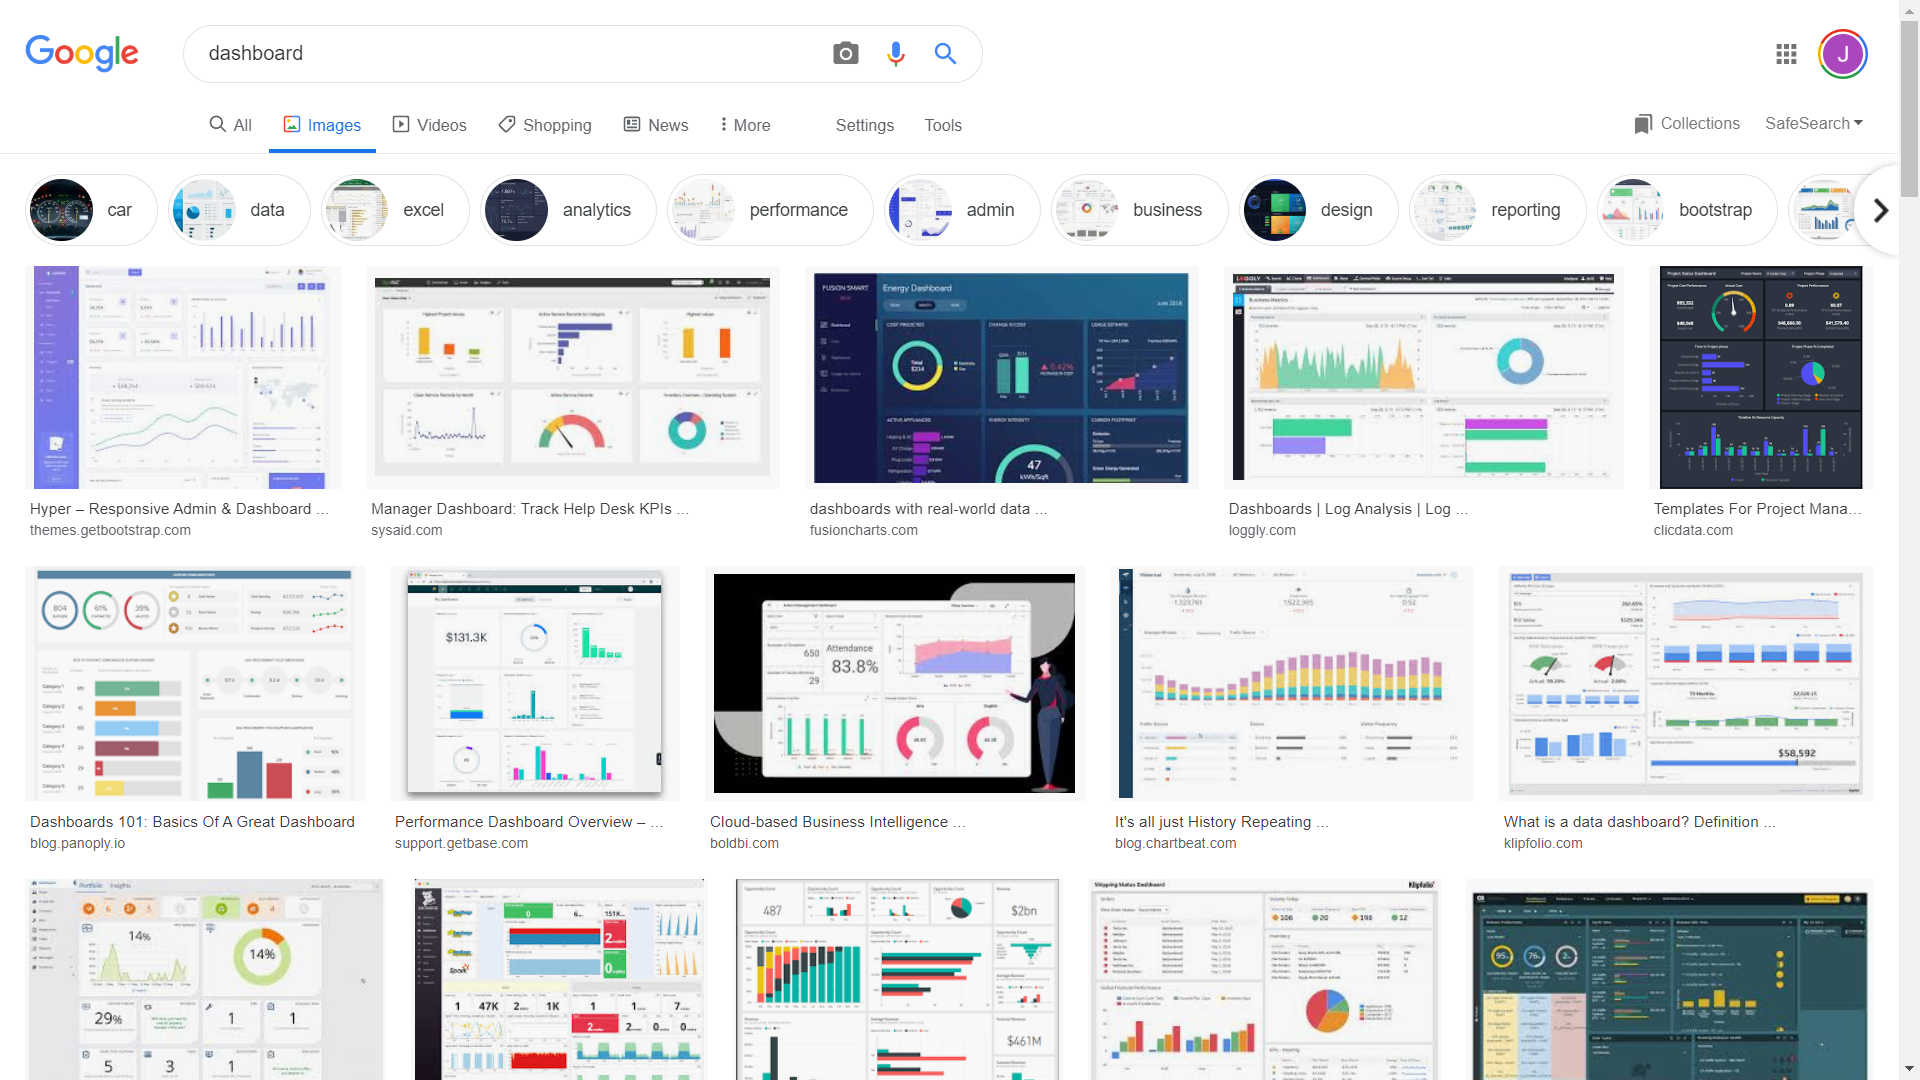
Search “dashboard” using a Google Image search. Scroll through the results. What do you notice? What proportion of the dashboards include pie charts and other charts based on polar coordinates? It is unusually high. This raises an interesting question. Why do pie charts and dashboards appear to go hand-in-hand?
There are three possible reasons. The first relates to the concept of skeuomorphism. Skeuomorphism is used to explain the existence of nonfunctional design elements present in modern things which throwback to the original. For example, Van Slembrouck (2012) explains why modern car speedometers are still circular even though they are now completely digital. The original mechanical speedometers where circular because the wheels would spin a cable which created a magnetic field to move the speedometer’s needle. This was the cheapest way to build speedometers back in the day. However, all modern cars now have computerised dashboards and there is no technical reason why speedometers need to be radial. The persistent use of a radial speedometer is an example of skeuomorphism. Another great example is circular smart watches. Square screens are easy to manufacture, but consumers wanted smart watches to look like ordinary watches. Motorola was one of the first major brands to invest in the development of circular screens for their Moto 360 smart watch in 2014. Interestingly, Apple have so far stuck to their square design. Many people think the square screens look odd. In short, the use of pie charts and other plots based on polar coordinate systems might be a throwback to automobile dashboards and specifically the speedometer. That’s interesting, but paying homage to inspiration behind data visualisation dashboards isn’t a strong justification.
Another possible reason might relate to a seemingly innate propensity to use meaningless variety when designing dashboards. Again, look back to your Google Image search results. For each dashboard, count how many different plot types appear. You will often see pie charts used in combination with bar charts. You know bar charts are more accurate and generalisable, so why use both? That’s a really good question and it might come down to a desire to make our dashboards looks sophisticated and technical. Using multiple data visualisation methods might make the dashboard look more impressive or aesthetically pleasing. However, these are not good reasons. Using a consistent plot type can make your dashboard more efficient. Pie charts do grab attention, so you still might be tempted to use them. However, don’t be. You can still use emphasis (position and size) and colour to guide the viewer’s attention.
The third reason, which is somewhat related to the first two, is established norms. Most people learn about dashboard development from software providers. The first dashboard they see and practice on will most likely include pie charts, gauges and other plots based on polar coordinate systems. That’s what the software developers think their customers want. Therefore, they sell and train people in products that make these methods easy. Their customers go onto rely on these methods and then demand these methods in future products. This is an example of a feedback loop.
So what does this all mean? This might sound like an esoteric rant, but there are some important lessons from this discussion that you should keep in mind for dashboard design:
- Dashboards rely on good data visualisation practice. Use the best method for the data and avoid deception.
- Dashboards can re-use the same plot type (avoid unnecessary variety) and by doing so it will make the dashboard more efficient for the viewer.
- Be critical of dashboard examples and templates provided by software companies and online. They are often trying to sell you a product as opposed to helping you design an effective dashboard.
10.3 Dashboards in R
You have two main options for making dashboards in R: flexdashboard and shinydashboards. The following examples demonstrate the basic functionality of each package. These packages are very powerful, so you are encouraged to refer to the package documentation website for further information and examples of their features.
10.3.1 flexdashboard
flexdashboard makes use of an R Markdown template and integrates well with Shiny and Plotly. First, install the package.
install.packages("flexdashboard")Then create a new R Markdown file using the flexdashboard template.
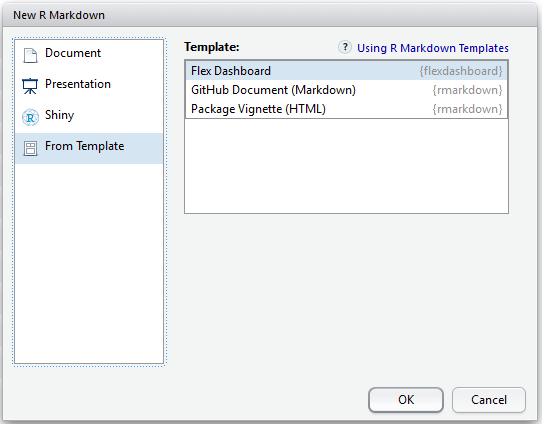
This will open an R Markdown template that you can start filling in. The flexdashboard documentation is excellent for learning how this package works. The packages uses R Markdown output options and code to arrange your visualisations. Let’s study an example to see what this means.
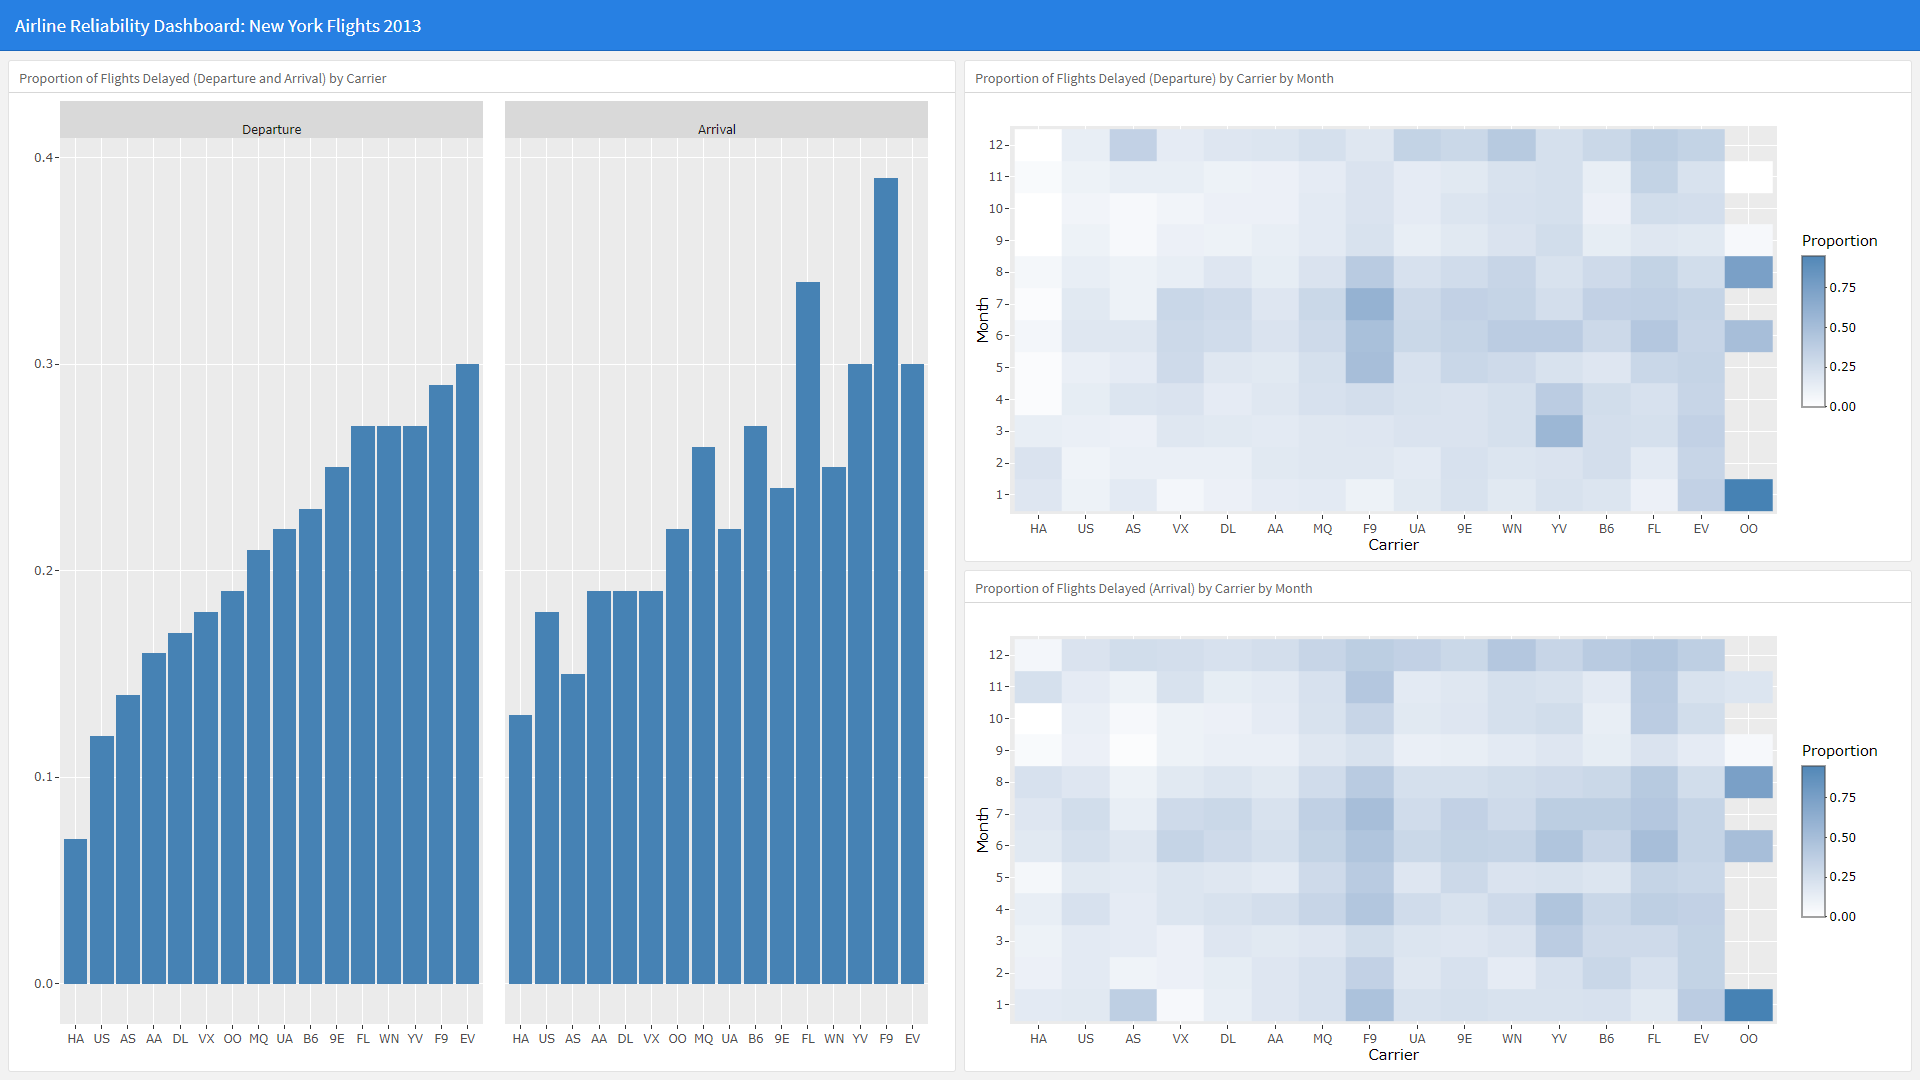
Let’s create a dashboard that provides an annual summary of airlines’ performance for nycflights13 data. This dashboard will be consumer-focused, “Who is the most and least reliable airline?”
Here is the sample_dash.Rmd code. You will have to download as sample_dash.txt and save it as .Rmd. Please download the .txt version of this file here.
Take note of the flexdashboard::flex_dashboard: orientation: columns option in YAML header and use of Column {data-width=650} and ------- breaks to organise the layout of the dashboard.
Here is a screenshot of the dashboard. Click here to view the dashboard full screen.
10.3.2 shinydashboard
shinydashboard integrates with the Shiny framework and provides a high level of control of layout and appearance. First, install the package:
install.packages("shinydashboard")To use this package, the ui must include the dashboardPage() layout and dashboardHeader(), dashboardSidebar() and dashboardBody(). The following example demonstrates these requirements (thanks to Micah Agustin for this example). However, note that the dashboardSidebar() was hidden. If you want multiple pages for your dashboard, you can enable this sidebar.
# Load packages and prepare data

library(plotly)
library(shiny)
library(shinydashboard)

body <- read.csv("Body.csv")

# Compute a correlation matrix for heat map

body <- body[,-1] # Remove ID variable
correlation <- round(cor(body), 3)
correlation[correlation == 1] <- NA
nms <- names(body)

# Assign ui function

ui <- dashboardPage(
  dashboardHeader(title = "Body Data Correlation Dashboard"),
  dashboardSidebar(disable = TRUE),
  dashboardBody(
    fluidRow(
      box(title = "Correlation Heatmap Matrix", plotlyOutput("heat")),
      box(verbatimTextOutput("selection"))
    ),
    fluidRow(
      box(title = "Scatter plot", plotlyOutput("scatterplot"), width = 6),
      box(title = "Histogram", plotlyOutput("histx"), width = 3),
      box(title = "Histogram",  plotlyOutput("histy"), width = 3)
    )
  ))

# Assign server function

server <- function(input, output, session) {
  output$heat <- renderPlotly({
    plot_ly(x = nms, y = nms, z = correlation,
            key = correlation, type = "heatmap",
            colors = "RdYlBu", source = "heatplot") %>%
      layout(xaxis = list(title = ""),
             yaxis = list(title = ""))
  })

  output$selection <- renderPrint({
    s <- event_data("plotly_click", source = "heatplot")
    if (length(s) == 0) {
      "Click on a cell in the heatmap to display a scatterplot"
    } else {
      cat("You selected: \n\n")
      as.list(s)
    }
  })

  output$scatterplot <- renderPlotly({
    s <- event_data("plotly_click", source = "heatplot")
    if (length(s)) {
      vars <- c(s[["x"]], s[["y"]])
      d <- setNames(body[vars], c("x", "y"))
      yhat <- fitted(lm(y ~ x, data = d))
      plot_ly(d, x = ~x) %>%
        add_markers(y = ~y) %>%
        add_lines(y = ~yhat) %>%
        layout(xaxis = list(title = s[["x"]]),
               yaxis = list(title = s[["y"]]),
               showlegend = FALSE)
    } else {
      plotly_empty()
    }
  })

  output$histx <- renderPlotly({
    s <- event_data("plotly_click", source = "heatplot")
    if (length(s)) {
      vars <- c(s[["x"]], s[["y"]])
      d <- setNames(body[vars], c("x", "y"))
      yhat <- fitted(lm(y ~ x, data = d))
      plot_ly(d, x = ~x, type = "histogram") %>%
        layout(xaxis = list(title = s[["x"]]),
               showlegend = FALSE)
    } else {
      plotly_empty()
    }
  })

  output$histy <- renderPlotly({
    s <- event_data("plotly_click", source = "heatplot")
    if (length(s)) {
      vars <- c(s[["x"]], s[["y"]])
      d <- setNames(body[vars], c("x", "y"))
      yhat <- fitted(lm(y ~ x, data = d))
      plot_ly(d, x = ~y, type = "histogram") %>%
        layout(xaxis = list(title = s[["y"]]),
               showlegend = FALSE)
    } else {
      plotly_empty()
    }
  })

}

# Deploy app

shinyApp(ui = ui, server = server)
Here is the result. Click here to go full-screen in order to avoid scrolling.